Econ 57 Fall 2002 Midterm Answers
1. Here are the answers:
a. time series graph
b. scatter diagram
c. scatter diagram
d. scatter diagram
e. side-by-side boxplots
2. 0.763 = 0.000000000174
3. The first ball can land in any box, the second ball has to land in one of the remaining two boxes, and the third ball has to land in the last box: 1(2/3(1/3) = 2/9.
4. As the number of binomial
trials increases, it is increasingly certain that the success proportion x/n
will be close to the success probability p, but less likely that it will be
exactly equal to p. Thus the probability is larger for the
a. small college
b. large college
c. small college
5. Maybe it is the unhealthy behavior that encourages procrastination, or some psychological issue that causes both.
6. Adjusting the bar heights for the fact that the second interval is 2.5 times as wide as the first intervals and the third interval 5 times as wide, a histogram looks like this:
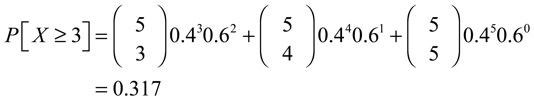
7. Using the binomial distribution,
8. We can use Bayes’ Rule or a contingency table to show that the probability is 10/19:
|
fire
|
no fire
|
total
|
|
| careless |
10
|
990
|
1,000
|
| careful |
9
|
8,991
|
9,000
|
| total |
19
|
9,981
|
10,000
|
9. All of the answers use the expected value
a. If 90 percent of the households
are Careful and 10 percent are Careless, the overall
probability of fire is 0.001(0.9) + 0.010(0.1) = 0.0019. If insurance companies
cannot distinguish the Careful from the Careless, they will price fire insurance
policies using the overall 0.0019 probability of fire damage. For a $200,000
home, the expected loss is 0.0019($200,000) = $390 which is substantially less
than the $1,000 cost of the policy.
b. For the Careful, the expected loss is 0.001($200,000) = $200 and they may choose not to pay $1,000 for fire insurance.
c. For the Careless, on the other hand, the expected loss is 0.010($200,000) = $2,000 and $1,000 fire insurance is a bargain. If the Careless buy fire insurance and the Careful don’t, the insurance company will have sold policies for $1,000 that have an expected payout of $2,000, and it will go bankrupt. The insurance company used the overall 0.0019 probability of fire to price its policies, but the Careless people who choose to buy insurance have a 0.01 probability of fire.
10. The heights of the bars are not proportional to income per share; in particular, the second bar should be only about half the size of the first bar. Did they start the vertical axis at a negative number?