2. Using the subtraction rule and multiplication rule:
3. Using the normal distribution and 1-standard-deviation rule of thumb, there is roughly an 0.84 probability that an exam will be more difficult than the exam being distributed and a 0.16 probability that an exam will be less difficult.
4. Marilyn's correct reply:
Yes and no. Yes, the next number to be drawn is more likely to be even, but no, you would not increase your chances by choosing an even number. That is, if you could place a bet that the next number would be even, you'd win more often than you'd lose; after all, there are more even numbers left.
But that's not an option. Instead, you must choose a particular even number. Say, it's No. 2. Because there aren't any more 2's than any other number, your chances of winning are only 1 in 9—the same as if you'd chosen any one of those other numbers—including the odd ones.
5. Sequels are made of the best movies, which usually have no where to go but down. There is a random element in making movies (otherwise, every movie from a particular director and cast would be equally good), and a box-office smash probably had more good fortune than bad, which cannot be counted on in the sequel.
6. Converting to a standardized z value,
7. We can use the sampling distribution for the sample mean to compare 6-person and 12-person juries. If x is normally distributed with mean m and standard deviation s, then the sample mean is normally distributed with mean m and standard deviation equal to s, divided by the square root of the sample size.
Thus the awards for both 6- and 12-person jury systems are normally distributed with the same mean, $5 million. But the standard deviation of the 6-person system is
8. Sample 2 clearly has a higher mean. There is relatively little variation within each sample and the sample sizes are substantial. The two-sided P value for a test of H0: m1 = m2 is surely smaller than than 0.05.
9. Here are the relative frequencies:
| Households in 1890 | Households in 1990 | |||
| Size | Number | Relative Frequency | Number | Relative Frequency |
| 1 | 0.457 | 0.457/12.690 = 0.036 | 23.0 | 23.0/93.8 = 0.245 |
| 2 | 1.675 | 1.675/12.690 = 0.132 | 30.2 | 30.2/93.8 = 0.322 |
| 3 | 2.119 | 2.119/12.690 = 0.167 | 16.1 | 16.1/93.8 = 0.172 |
| 4 | 2.132 | 2.132/12.690 = 0.168 | 14.6 | 14.6/93.8 = 0.156 |
| 5 | 1.916 | 1.916/12.690 = 0.151 | 6.2 | 6.2/93.8 = 0.066 |
| 6 | 1.472 | 1.472/12.690 = 0.116 | 2.2 | 2.2/93.8 = 0.023 |
| 7+ | 2.919 | 2.919/12.690 = 0.230 | 1.5 | 1.5/93.8 = 0.016 |
| Total | 12.690 | 1.0000 | 93.8 | 1.000 |
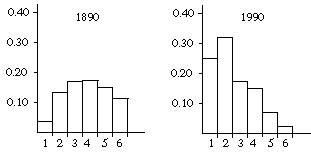
10. a. The median household is 93.8/2 = 46.9 million households in from either end; because this is among the 32.0 million people living in 2-person households; therefore, the size of the median household is 2.
b. The median individual is 264/2 = 132 million individuals in from either end. There are 23.0 million people in 1-person households, 2(30.2) = 60.4 million people in 2-person households, and 3(16.1) = 48.3 million people in 3-person households--giving a total of 131.7 million people in the first three categories. Because the median individual is among the 14.6 million people living in 4-person households, the size of the median household is 4.
c. If we average the class size over the number of classes, a class with 100 students counts as 1 observation and a class with 1 student counts as 1 observation, giving an average class size of (100 + 1)/2 = 50.5. If we average the class size over the number of students, a class with 100 students counts as 100 observations and a class with 1 student counts as 1 observation, giving an average class size of (100(100) + 1)/101 = 99.0. (One hundred out of 101 students are in a class with 100 students.) From the professor's perspective, the average class has 50 students. For the student's perspective, the average class has 99 students, proving once again that it is better to be a professor than to be a student.
11. a. The value of R2 compares the sum of the squared errors in predicting y with the sum of the squared deviations of y about its mean:
c. One property of the estimators a and b that minimize the sum of squared errors is that the predicted value of y is equal to the average value of y when x is equal to its average value. The average value of x is
e. The finding that these data do not reject b = 0 at the 5 percent level does not provide "statistically significant evidence" that b is equal to zero. Not rejecting b = 0 is not the same as proving b = 0.
12. a. The null hypothesis is that hiring and promotion are independent of race.
b. If the null hypothesis is true and the court requires statistical significance at the 5 percent level in all eight categories, the probability that the null hypothesis will be rejected in eight independent tests is 0.058 = 0.0000000000391.
c. If the court requires statistical significance at the 5 percent level in at least one of the eight job categories, the probability of rejecting the null hypothesis is equal to one minus the probability of not rejecting the null hypothesis in all eight categories: 1 - 0.958= 0.337.
13. a. Data that are divided into eight job categories might not show statistical significance in any of the categories because each of the eight samples is too small, even though there is a statistically significant relationship when the data are aggregated.
b. Data that are divided into eight job categories might show statistical significance in some categories in favor of blacks and in other categories in favor of whites, differences that cancel when the data are aggregated.
14. The first two equations show a positive, statistically significant relationship between median SAT scores and graduation rates and between high school grades and graduation rates. These positive effects persist when we run a multiple regression equation that includes both explanatory variables, though the coefficient of the SAT variable drops slightly and so does its t value and the grades coefficient drops dramatically and is no longer statistically significant. Evidently, SAT scores and grades are positively correlated, so that omission of either from the multiple regression equation makes it seem like the other variable has a larger effect.
15. The standard deviation used in the z-value calculation takes into account the size of the sample. There is no need to invalidate the z-value because of the small sample size.
16. Applying the multiplication rule, this probability is
17. There were 21 such days, divided among the months as follows:
| November | 6 |
| December | 7 |
| January | 6 |
| February | 2 |
In fact, matters are more complicated because these months do not have an equal number of days to begin with and these researchers did not collect data for all of November or February. We have data for 26 days, divided as follows:
| Number of Days | Fraction of Days | |
| November | 6 | 6/26 = 0.231 |
| December | 7 | 8/26 = 0.308 |
| January | 6 | 8/26 = 0.308 |
| February | 2 | 4/26 = 0.154 |
| Total | 26 | 1.00 |
| Observed | Expected | |
| November | 6 | 0.231(21) = 4.85 |
| December | 7 | 0.308(21) = 6.47 |
| January | 6 | 0.308(21) = 6.47 |
| February | 2 | 0.154(21) = 3.23 |
| Total | 21 | 21 |
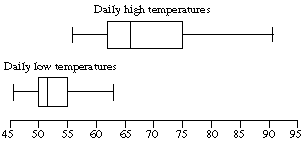
18. Here are the low and high temperatures in numerical order:
| Daily Low Temperatures | Daily High Temperatures | ||||||
| 63 | 54 | 51 | 49 | 91 | 73 | 66 | 59 |
| 60 | 54 | 51 | 49 | 80 | 71 | 64 | 58 |
| 59 | 54 | 50 | 47 | 79 | 70 | 62 | 57 |
| 56 | 53 | 50 | 47 | 78 | 68 | 62 | 57 |
| 56 | 53 | 50 | 46 | 77 | 67 | 62 | 56 |
| 56 | 52 | 50 | 77 | 66 | 62 | ||
| 55 | 51 | 50v v75 | 66 | 59 |
The calculations are similar for the high temperatures, since there are 26 observations here too. The median is halfway between the 13th and 14th observations; since these are both 66, the median is 66. The first quartile is the 7th of the 13 observations below the median: 62. The third quartile is the 7th of the 13 observations above the median: 75. The whiskers are at the minimum(56) and the maximum (91).
Here are the box plots:
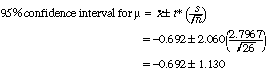
19. The sample mean is -0.692 degrees and the sample standard deviation is 2.7967 pounds. There are n - 1 = 26 - 1 = 25 degrees of freedom. Table 4 in the textbook shows that the value for a 95 percent confidence interval is t* = 2.060. Our 95 percent confidence interval is
20. This reasoning is based on the fallacious law of averages: because the U.S. stock market had recently outperformed foreign stock markets, this past performance must be balanced out by U.S. stocks now underperforming foreign stocks.
If we think of the relative performance of U.S. stocks and the EAFE index each year as an annual coin flip, there is nothing at all unusual about four heads (or four tails) in a row. In twenty coin flips, there is a 0.768 probability that there will be at least one streak in which four (or even more) flips in a row will be the same. (This is a difficult calculation.) When a streak of consecutive heads does occur, the probability of heads on the next flip is still 0.5.
Stock prices are not determined by coin flips, but, like coin flips, there is no compelling reason why a streak of good years should increase the chances of a bad year. Those investors who held U.S. stocks when this Wall Street Journal article appeared surely expected attractive returns from their investment; otherwise, they would have invested in something else, such as foreign stocks. What matters to investors is not whether today's stock prices are high or low relative to the past, but whether today's prices are reasonable relative to their expectations of future stock prices. There is no persuasive reason why a rise in U.S. stock prices in 1991 had to be balanced out by a fall in 1992, or why a relatively poor performance of foreign stocks in 1991 had to be balanced out by a relatively strong performance in 1992. As it turned out, the U.S. stock market went up again in 1992, while the EAFE index fell 7 percent, making four years in a row that U.S stocks did better than foreign stocks.
