Econ 57
Gary Smith
Fall 2007
Midterm (75 minutes)
No calculators allowed. Just set up your answers; e.g. P = 49/52
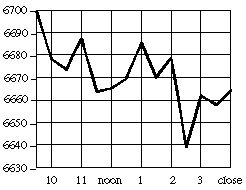
1. Explain why this graph of the Dow Jones Industrial Average of stock prices on January 27, 1997 gives a misleading visual impression of the volatility of stock prices that day:
2. The Public Health Service has tabulated data on the number of divorces, according to the month in which the marriage ceremony was performed. Thus 6.4 percent of all divorces involve couples who were married in January. Do these data show that persons who marry in June or August are more likely to get divorced than are people who marry in January?
Month |
Fraction of |
Month |
Fraction of |
Month |
Fraction of |
Married |
Divorces |
Married |
Divorces |
Married |
Divorces |
| January |
0.064 |
May |
0.080 |
September |
0.090 |
| February |
0.068 |
June |
0.117 |
October |
0.078 |
| March |
0.067 |
July |
0.087 |
November |
0.079 |
| April |
0.073 |
August |
0.103 |
December |
0.087 |
3. What are the sucker’s chances of winning the following game?
Take a small opaque bottle and seven olives, two of which are green, five black. The green olives are considered the “unlucky” ones. Place all seven olives in the bottle, the neck of which should be such a size that it will allow only one olive to pass through at a time. Ask the sucker to shake them and then wager that he will not be able to roll out three olives without getting an unlucky green one amongst them.
4. In the 1930s, Horace Secrist, a statistics professor at the Northwestern University, wrote a book with the provocative title The Triumph of Mediocrity in Business. Secrist had found that businesses with exceptional profits in any given year tend to have smaller profits the following year, while firms with very low profits generally do somewhat better the next year. From this evidence he concluded that strong companies were getting weaker, and the weak stronger, so that soon all would be mediocre. How might a statistician explain these data, without making any economic assumptions?
5. For each of the following studies, identify the type of graph (side-by-side box plots, scatter diagram, or time series graph) that would be the MOST appropriate:
a. Are stock returns more volatile than bond returns?
b. Do interest rates affect home construction?’
c. Is the rate of inflation higher or lower now than in the past?
d. Do cigarette sales depend on cigarette prices?
e. Is the amount of precipitation in January essentially the same in Chicago, Los Angeles, and New York?
6. A Pomona student was asked this question in a banking job interview. A can contains 20 coins, 19 of which are normal coins and 1 of which has heads on both sides. A coin is randomly selected from the can and flipped five times. It lands heads all five times. What is the probability that it is the two-headed coin?
7. Identify the most important statistical problem with this study and explain how you would redo the study to get rid of this problem: A study of the effects of youth soccer programs on self-esteem found that children who had played youth soccer had more self-esteem than children who had not participated in youth soccer programs.
8. The average life of a Rolling Rock tire is normally distributed with a mean of 30,000 miles and a standard deviation of 5,000 miles. Consider these four probabilities:
a. a tire will last more than 30,000 miles.
b. a tire will last more than 40,000 miles.
c. the average life of a random sample of 4 tires will be more than 30,000 miles.
d. the average life of a random sample of 4 tires will be more than 40,000 miles.
You do NOT have to calculate these probabilities. Instead, simply rank order these four probabilities from largest to smallest; for example, if you think that (a) has the highest probability, (b) the next highest, (c) the next highest, and (d) the smallest probability, your answer would be a, b, c, d.
9. The Romeros are planning their family and want an equal number of boys and girls. Mrs. Romero says that their chances are best if they plan to have two children. Mr. Romero says that they have a better chance of having an equal number of boys and girls if they plan to have ten children. Assuming that boy and girl babies are equally likely and independent of previous births, let’s see who is right.
a. What is the probability of an equal number of boys and girls if they have two children? If they have ten children? (Just set up the formulas; do not calculate the probabilities.)
b. Which probability do you think is higher? Explain your reasoning.
10. Answer this question that a reader asked Marilyn vos Savant, who is listed in the Guinness Book of World Records Hall of Fame for “Highest IQ”: “During the last year, I’ve gone on a lot of job interviews, but I haven’t been able to get a decent job.… Doesn’t the law of averages work here?”