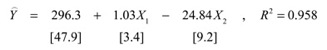
14.6 The estimated equation (with the t values in brackets) is:
This equation shows substantial, appropriately signed, and statistically significant (at the 5 percent level) effects of profits and interest rates on stock prices. (With 7 - 3 = 4 degrees of freedom, the cutoff for a two-tail test at the 5 percent level is a t-value larger than 2.776.)
The 1.0 drop in profits in 1985 is estimated to have depressed stock prices by -1.0(1.03) = -1.03 while the 1.61 drop in the interest rate increased stock prices by -1.61(-24.84) = 39.99. In 1986, profits were unchanged and the 1.95 drop in the interest rate is estimated to have increased stock prices by -1.95(-24.84) = 48.44. As in the textbook discussion, this estimated equation explains the 1985 and 1986 stock market surge by the drop in interest rates.
14.28 The phrase "not significant" refers to the fact that the estimated coefficient of the extracurricular dummy variable is not statistically significant at the 5 percent level, in that its t-value is less than 2: t = 0.085/0.289 = 0.29. The coefficient of the dummy variable measure the extent to which extracurricular activity affects grades, holding study time constant (since study time is another explanatory variable in the equation). The coefficient of the dummy variable compares students who study equally, but one participates in an extracurricular activity in addition, and the other doesn't. (There might be an effect, for example, if the student is physically or emotionally drained by the extracurricular activity.)
14.37 A simple regression of the length gain on birth weight is evidently negative because heavier babies also tend to be taller and the relatively small positive effect of birth weight on length gain is swamped by the negative effect of birth length on length gain. In fact, birth length and birth weight are positively correlated (the correlation coefficient is 0.57).
14.40 Here are the estimated equations (with the t values in brackets):
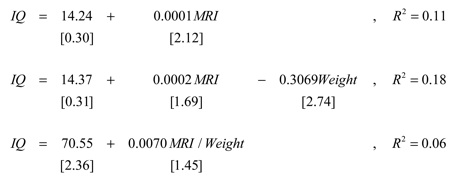
The second equation is the more successful in predicting IQ scores, as gauged by the value of R2. In addition, the signs of the two coefficients are plausible: for a given weight, an increase in brain size increases IQ; for a given brain size, an increase in weight reduces IQ. Evidently, the size of the brain relative to body weight matters, but not in a simple ratio of MRI to weight.
14.41 Here is the estimated equation (with the t values in brackets):
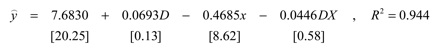
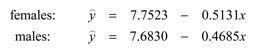
By assigning the values D = 1 for females and D = 0 for males, we can break this equation into its female and male components:
The 8.62 t value shows that the coefficient of the log of distance is highly statistically significant. The low t values on the coefficients of D and Dx show that these data do not reject the null hypotheses that the female and male intercepts are equal and the female and male slopes are equal.
