Career Trajectories in Baseball
Teddy Schall and Gary Smith
Pomona College, Claremont, CA 91711
Major league baseball rookies are scrutinized carefully for evidence of their ability to succeed in the big leagues. Many are weeded out. Others have long careers. We investigate here the typical performance record for baseball hitters and pitchers during the course of their careers. We also consider whether the length of a player’s career can be predicted accurately from his first-year performance. When a team offers a promising young player a long-term contract, is it buying a star or rolling dice? It turns out that first-year performance is an important predictor but that there is a great deal of individual variation.
Data
We examined the season batting averages (BAs) and earned run averages (ERAs) for all major league baseball players from 1901 through 1999, using the data in the sixth edition of Total Baseball, which is available on the web site www.baseball.com. To reduce the influence of outliers on our performance measures, we excluded any season in which a player had fewer than 50 official times at bat or 25 innings pitched. In order to study career lengths, we further restricted our attention to persons who did not play in the 1999 season, presumably because they had retired. A few players sat out the 1999 season because of injuries or were temporarily relegated to the minors, and will resume their careers at a later date. However, the exclusion of these few exceptions seemed preferable to restricting our analysis to persons who had not played in, say, the last 5 years.
Our final database contained 4728 hitters, with careers ranging from 1 to 24 seasons, and 3803 pitchers, with careers ranging from 1 to 26 seasons. The mean career length is 5.6 years for hitters and 4.8 years for pitchers. To compare performances in different seasons, each player’s performance was standardized by subtracting the mean for all players that year and dividing this difference by the standard deviation of performance across players that year. We reversed the signs of the standardized ERAs so that, like BAs, high standardized values represent above-average performance.
Figure 1 shows the standardized season batting averages of three extraordinary ballplayers–Ty Cobb, Willie Mays, and Bob Uecker. Cobb’s standardized BA was —0.173 his rookie year; this was followed by an unparalleled run of 23 seasons in which his lowest standardized BA was 1.018, in his last season. Mays batted 0.465 standard deviations above the major league average his first year and 0.389 standard deviations below his second year. After many years of outstanding performances, his standardized BA fell to —0.963 in his last season. Uecker is noteworthy for being allowed to play five below-average years; his worst year was his last, when he batted 2.017 standard deviations below the major league average. Uecker later achieved fame as a baseball announcer and personality, often telling stories from his "illustrious" career.
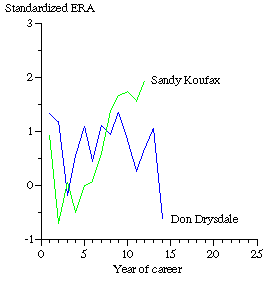
Figure 2 shows the standardized ERAs of two Dodger teammates, Don Drysdale and Sandy Koufax. As is true of most pitchers with relatively long careers, each outperformed established players in his rookie season. Drysdale was a better-than-average pitcher for 11 of the next 12 years, then fell to 0.627 standard deviations below average in his final year. Koufax is a remarkable exception to the typical pitching career. After a good rookie year, he had five mediocre years, followed by six very, very good years. His best season was his last, when his ERA was 1.925 standard deviations better than the major league average.
Survival Probabilities
Figure 3 shows the yearly survival rates for baseball players; that is, the probability of playing at least one more year if a player has played a given number of years. (The 32 hitters and 31 pitchers with careers of 20 years or longer were consolidated, with the reported fraction at year 20 showing the average survival rate for all of the remaining years.) The survival rate is below average in the first year (77% for hitters, 73% for pitchers), strong for the next several years (peaking at 87% in year 7 for hitters, and at 84% in year 5 for pitchers), and then generally declines. The relatively low survival rate in the first year is perhaps due to the fact that the additional information gained about a player’s skills during his first year playing against major league competition is much greater than the additional information gained during, say, a player’s fifth season. The somewhat higher survival rates for the next several years for those who make it past the first year may be because their skills are improving during this period. We will return to this conjecture.
A logit model was used to predict the probability P of playing another season in the major leagues as a function of the number of seasons t that a person has played in the major leagues, the player’s current season performance Z and the average performance over the player’s career (Z):
![]()
The estimates of the coefficients (and their standard errors) are shown in Table 1. These estimates are derived using the method of maximum likelihood assuming that the multiple observations for a single player are independent. The effects of seasons are small but highly statistically significant. The effects of current performance are substantial and statistically compelling; the effects of career performance are much smaller and, for hitters, not statistically significant.
Evaluated at the mean values of the explanatory variables, the estimated coefficients imply that each additional year in the major leagues reduces a player’s survival probability by 0.008 for hitters and 0.005 for pitchers. A one-standard deviation improvement in current performance increases the survival probability by 0.103 for hitters and 0.102 for pitchers; a one-standard deviation improvement in career performance increases a player’s survival probability by 0.003 for hitters and 0.015 for pitchers.
Career Performance Patterns
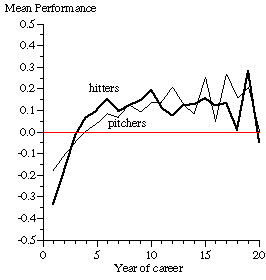
Figure 4 shows the mean value of the standardized BA and ERA in each year of the careers of the players in our database, again consolidating players with careers of 20 years or longer. Players typically perform below the league average in their first year in the major leagues: on average, 0.337 standard deviations below for hitters and 0.176 standard deviations below for pitchers. The fact that the average standardized first-year ERA is better than the average standardized first-year BA means that, in comparison to established players, pitchers tend to do better in their rookie seasons than do hitters. Perhaps it is easier to predict a pitcher’s initial success in the major leagues. Or a rookie pitcher’s style may present more of a challenge to opposing hitters than does a rookie hitter’s style to opposing pitchers.
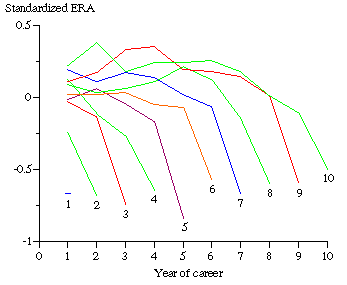
Figure 4 shows that the mean performance increases after the first year, though this may be due more to weak players being weeded out than to players improving with experience. Remember, 23% of the rookie hitters and 27% of the rookie pitchers don’t play a second year. In order to disentangle the confounding effects of player skills changing during their careers and career lengths depending on player skills, we grouped the players by career length and examined the average career trajectory for the players in each career group. Other influences surely matter too–a player’s health, teammates, ballpark, and skills that are not measured by BA or ERA. In reasonably sized samples, these idiosyncratic factors will average out and allow us to see the systematic patterns. We consequently restricted out analysis to career lengths for which we have data on at least 100 players: up to 13 years for batting averages, 10 years for earned run averages. Figures 5 and 6 show the results.
First, notice that for hitters and pitchers of all career lengths, the average standardized terminal-year performance is substantially below 0, the average performance of all major league players. The best average terminal-year values are —0.502 for ERAs and —0.539 for BAs, both for players terminated in their tenth year. Termination after such poor performances is not surprising because the decision to terminate is based on perceived inability to perform. Remember our earlier finding that the average first-year performance is —0.337 for hitters and —0.176 for pitchers. It makes sense to replace an older player with a standardized performance of —0.5 with a rookie whose expected standardized performance is —0.3 or —0.2, particularly if the older player is more expensive. The precipitous decline in performance near career end challenges the wisdom of long-term contracts and confirms the wisdom of Branch Rickey’s dictum that it is better to trade a veteran a few years early than one year too late.
Second, hitters who last more than a few seasons tend to improve each year until the decline that precedes their termination. Pitchers, in contrast, typically do not improve with experience; pitchers with long careers just seem more successful in postponing the deteriorating performance that will end their careers. Perhaps hitters improve as they become accustomed to major league pitchers, while pitchers wear out their arms.
It should be emphasized that the patterns in Figures 5 and 6 do not say that every player with a standardized performance of below —0.5 should be terminated. There is considerable variability in performance from year-to-year as we see in the next section.
First-Year Performance and the Length of a Player’s Career
For both hitters and pitchers, there seems to be a positive relationship between first-year performance and the length of a player’s career. We examine this more closely. Figure 7 shows a scatterplot of career length versus first-year performance for batting averages; the pattern for earned run averages is similar. Although these data decisively reject the null hypothesis that there is no relationship between career length and first-year performance (the correlation is 0.23 for batting averages and 0.21 for earned run averages), the relationship is far from perfect–explaining only 5 percent of the variation in career length. The estimated standard error of prediction of career length for a given first-year performance is approximately 4 years. An individual player’s career cannot be predicted confidently from his first-year batting average or earned run average.
The reason is not hard to find. The correlation between player performance from one season to the next is highly statistically significant, but the correlation coefficients are far from one: 0.38 for batting averages and 0.24 for earned run averages.
Conclusions
Part of the charm of baseball is that there are clear tendencies that are logical and statistically persuasive, even while specific outcomes deviate substantially from these tendencies. Baseball seasons have far more games than other sports, allowing the law of large numbers to work its magic and allowing plentiful opportunities for short-term departures from long-run tendencies. A batter can go 0 for 4 one game and 4 for 4 the next. A pitcher can throw a shutout one game and give up 5 earned runs in the first inning of the next game. A hitter can bat .350 one season and .250 the next; a pitcher can have a 1.50 earned run average one season and 5.00 the next. A team can win 100 games in a season and lose a World Series in 4 straight games. So it is with baseball careers–logical, statistically persuasive tendencies from which individual players can deviate greatly.
Table 1 Logit Predictions of a Player’s Survival Probability
|
Batting Averages
|
Earned Run
Averages
|
|||
|
bi
|
SE
|
bi
|
SE
|
|
| constant |
2.010
|
0.030
|
1.625
|
0.031
|
| seasons |
-0.058
|
0.004
|
-0.031
|
0.005
|
| performance |
0.794
|
0.025
|
0.677
|
0.026
|
| average performance |
0.022
|
0.033
|
0.100
|
0.036
|
Figure 1 Three Remarkable Hitters

Figure 2 Two Pitching Teammates
Figure 3 Fraction of Those Playing t Years Who Play at Least One Additional Year

Figure 4 Mean Standardized Performance, by Year of Career
Figure 5 Batting Average Patterns Over a Career, by Career Length

Figure 6 Earned Run Average Patterns Over a Career, by Career Length
Figure 7 Batting Averages, Predicting Career Length from First-Year Performance