Case Studies:
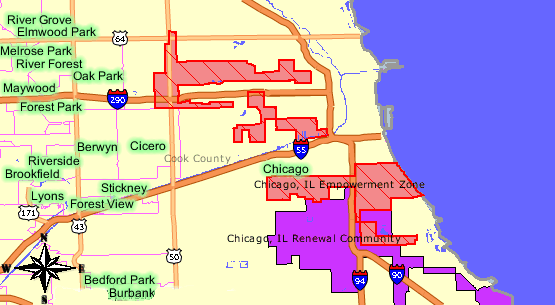
The Chicago Empowerment Zone consists of neighborhoods on the south and west sides of the city. The communities involved include Austin, Humboldt Park, East Garfield Park, West Garfield Park, Lower West Lawndale, North Lawndale, South Lawndale, New City, Washington Park, Oakland, Grand Boulevard, Kenwood, and Woodlawn. The combined population of the zone is 199,938 and covers 14 square miles.
Chicago has a total population of 2,783,726. The Chicago EZšs poverty rate as of 1996 was 49%, its unemployment rate 25%, and 15% of its residents were in public housing. The unemployment rate was higher than any other EZ except Detroit, and its poverty rate was higher than any other EZ except Atlanta. It was also the second biggest EZ for population and square mile size. 72% of the zones residents were African American, 24% are Hispanic, and less than 4% were white. In other Chicago communities (within the city) African Americans were 18% of the population and whites were 65% of the population. For other metro Chicago communities (outside the city), the contrast is even greater, where only 7% of the population was African American and 84% of the residents were white. 47% of EZ residents had annual family incomes of under $20,000. EZ residents had a mean family income of under $24,000, while other Chicago residents had a mean income of over $40,000.
Education levels are also very different for EZ residents compared to others residing in Chicago, as half of EZ zone residents have finished high school and 70% of other Chicago residents have completed high school.
Strategic Plan
One of the requirements in order to be approved for Empowerment Zone status was the development of a strategic plan and goals that the city sought to fulfill. Chicagošs primary goals included alleviating poverty and improving the way that federal, state, county and city governments interact with the EZšs residents. The Council outlined 7 initiatives to accomplish these goals:
1. Increase existing human/organizational capacity through the development of job training programs that teach life skills, job readiness, apprenticeship and mentoring.
2. Link health and human services by creating wellness system that encourages a healthier workforce
3. Improve public safety by increasing community security and increased participation by residents in keeping their environment safe.
4. Increasing investment in and by the community in order to economically empower the residents.
5. Creation of affordable and accessible housing and the increased home ownership for community residents
6. Create better options for youth through training programs and youth run-businesses.
7. Build on cultural diversity through promoting tourism, increasing and fostering cultural sensitivity.
Implementation
The city government has been operating and implementing the EZ program. The funds for Chicago pass through the state agency that manages the social security bock grant program. The EZ/EC Coordinating Council is the governing body for this program, and it includes 39 members representing businesses, communities in the zone, representatives from the 3 city designated neighborhoods and officials from the city, county and state governments. The responsibilities of the council include: developing zone-wide policies, identifying support resources, reviewing/recommending approval of requests, and funding of projects.
Some of the original projects undertaken as of October of 1996 include space rehabilitation, attempts to connect EZ residents to potential employers, promotion of home ownership, development of public schools into community learning centers, business training and the creation of a partnership with a local college to aid in preparation for the GED test. The city had taken out $279,000 at this point for these projects, and had approved a total of 86 programs for a total cost of $45 million, with $41 million coming from federal funding.
In 2000, HUD conducted a report on the progress of the Empowerment Zones. The study looked at employment, business ownership, and opinions of business owners. The study found that Chicagošs EZ experienced a -3% change in employment from 1995 to 2000, from 71,968 workers to 70,121. However, if compared to the -16% change for the period of 1990 to 1995, there was a decelerating decline in the employment level. The assessment used two areas as areas for comparison, one was designated the comparison area and the other was the contiguous area. The comparison area saw a reverse in its declining employment rate of -6% in the first half of the decade as employment grew by 32% from 1995 to 2000. The contiguous area experienced a similar trend, as the change in the growth rate from the first half of the decade to the second half was 17%. Compared to the comparison area the Chicago EZ had a difference in employment growth rate of -35% and in comparison with the contiguous area there was a difference of -4%. Chicago was the only Empowerment Zone out of the 6 that showed a decline in employment and only one of two zones to have unfavorable unemployment trends from 1995-2000 compared to the prior growth rate from 1990 to 1995.
The researchers conducted surveys of business establishments twice, once in late 1997 and early 1998 and the second in 2000. While the first wave was probably too early to pick up much of an impact from the designation of the area as an EZ zone, 2000 was 6 years after the EZ designation and 3-5 years after most programs were implemented. Therefore, this wave should have given the area sufficient time to pick up the impacts. However, one aspect that would have been felt soon after the EZ designation and picked up in the 97/98 survey were the incentives for hiring zone residents and investing in zone businesses.
Chicagošs Empowerment Zone experienced an 80% increase in the employment of zone residents by zone businesses. Residents as a portion of total business employment increased from 28% in wave one to 33% in wave two. The ratio of resident owned businesses to all zone businesses increased by 3%, although this was statistically insignificant. Resident and minority owned businesses were found as more likely to employ zone residents.
55% of surveyed businesses said that the Empowerment Zone was a good place to do business in 97/98 and the frequency of this response improved to 60% in 2000, although there may have been selection bias because firms that believed differently may have left.
The owners were also asked what the best and worst things were about doing business in the EZ in the summer of 2000. 31% responded that the location was easy for customers/suppliers to reach, 14% said that it was easy for the owners/employees to reach, and 14% said that the EZ provided good access to public transportation. On the other hand, 47% of owners reported crime and safety as the worst problem with doing business in the EZ, while only 21% of New York owners cited this as the worst problem. 9% cited run down property/poor appearance, 8% cited poor city services and 8% cited difficulties finding parking as the worst aspects of conducting business in the EZ.
Business ownersš perceptions of the EZ were mixed, or perhaps they were just unaware of the impact it had had. The 2000 survey asked, ęTo what degree was the EZ program contributing to causing favorable trends/good news?ė While more business believed the designation of the area as an Empowerment Zone had a positive rather than negative impact, 56% of respondents in wave 1 stated that the impact was neither good nor bad and 60% in wave 2.
This interesting trend continued when the owners were asked what the most important help received from the EZ program was in 2000. 62% responded that they thought nothing was helpful, they hadnšt received help or they were unaware of any programs. This number was similar to the other Empowerment Zones. 12% of owners stated that the federal tax cuts were the most helpful, and this response rate was higher than other cities. 4% cited improved zone appearance or image as the most helpful improvement.
Finally, Chicago had disappointing results with new investment in its EZ. Although by 2000 it had spent $27 million, it had only received $110 million in new investment. Although this is a sizable amount, it is disappointing when compared to the new investment of $2.3 billion in New York after only $17.6 million was spent.
While the Chicago Empowerment Zone had some positive signs, including increased minority owned businesses and employment of EZ zone residents, there were also serious issues. These included the disappointing employment rates compared to the comparison and contiguous areas. It also appears the city was unable to notify owners of the advantages of locating their business in the EZ.
The Woodstock Institute said that Chicagošs EZ hadnšt made enough tax credit jobs available to the zone residents. While there were roughly 80,000 jobs in the EZ, if the tax credit zone for the EZ was expanded by one or two miles the residents would have access to 320,000 jobs.
In 1997, federal authorities handed out grades to all of the EZs and ECs. The Chicago EZ received an average grade, citing the slow progress due to ętensions between the role of the community and the role of the city.ė Along these lines, the Chicago Empowerment Zone has had serious issues with its Empowerment Zone Coordinating Council. There has been the questionable practice of council members staying for votes on contracts that they were involved in. With 39 members on the council it makes it difficult for decisions to be made efficiently. In this same report, the most significant criticism by HUD was the only ęmoderateė private investment that had occurred and the slow progress on contracting new projects.
The average grade given by federal authorities seems appropriate. The 10 years since its designation is coming up, and seeing more recent results would be helpful in evaluating the success of the program. As of 2000 it appeared that there were moderate improvements. However, in private investment, the area that is perhaps most important to the long-term health of the city, there was much room for imrprovement.
Sources:
ęEmpowerment Zone gets a mild grade.ė Chicago Sun Times. March 8, 1997.
Cedric Herring. http://www.audiobook1.com/eminchic.html
ęTax credits urged to promote hiring.ė Chicago Sun Times. December 4, 1996
United States General Accounting Office. Report to the Chairman, Subcommittee on Human Resources and Intergovernmental Relations, Committee on Government Reform and Oversight, House of Representatives. Community Development: Status of Urban Empowerment Zones. December 1996.
U.S. Department of Housing and Urban Development. Interim Assessment of the Empowerment Zones and Enterprise Communities Program: A Progress Report. November 2001.

.